
Dr Grant Forster
grant.forster@ncas.ac.uk
0160 359 3837
- WAO / Ceilometer
- WAO / ECD on Clarus 500 Greenhouse Gas Chromatograph – SF6 Monitor
- WAO / Reduction Gas Analyser – H2 Monitor
- WAO / O2 and CO2
- WAO / Camera
- WAO / FTIR
Not Applicable
Calendar
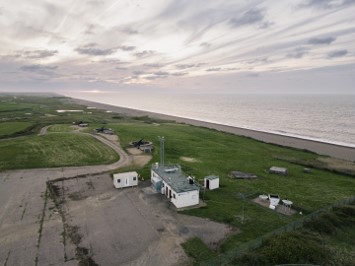
Weybourne Atmospheric Observatory (WAO)
The Weybourne Atmospheric Observatory (WAO) is a Regional station in the Global Atmosphere Watch (GAW) programme of the World Meteorological Organization (WMO). It is situated on the North Norfolk coast (52°57’02’’N, 1°07’19’’E, 15 m asl). Weybourne is operated by the UEA having been established in 1992 by Professor Stuart Penkett (retired 2004) with funding from BP (Norway) plc and NERC. Subsequently, long term monitoring and campaigns have been supported through numerous projects funded by NERC, Department of the Environment (DoE, Defra) and the EU. NCAS has also supported the site since 2002. Much of the instrumentation has come from HEFCE JIF and SRIF funds.
Weybourne’s location means that it experiences air with a wide range of pollution levels. Predominant south-westerlies bring polluted air from the UK (including from London and the Midlands). At times, especially in anticyclonic conditions, Weybourne experiences polluted air from Europe. Weybourne can also receive clean background air in northerly airflow. This can be impacted by narrow pollution plumes from shipping in the N. Sea, and potentially gas platforms.
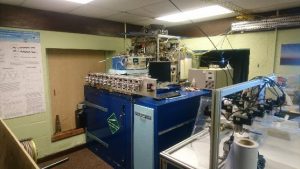
Over the years the parameters measured at Weybourne have varied according to the funding and/or scientific interests and requirements. There have been continuous measurements of ozone (O3), as part of the Defra network, and basic meteorological parameters. There are many years of CO, NOx, NOy, SO2, CN, VOC and H2 data. In 2007 a long term monitoring programme for CO2 and O2 began. In 2012 a new greenhouse gas GC was set up and measurements of CH4 started. This has been developed to also include measurements of N2O and SF6. In 2017 a state-of-the-art Fourier Transform Infrared Spectrometer (FTRI) was added to Weybourne to give very high precision measurements of additional CO2, CH4, N2O and CO. Finally in 2018 instruments were added to Weybourne to make long-term observation of atmospheric radon and particulate matter (PM1, PM2.5, PM4 and PM10).
Through the introduction of the FTIR to Weybourne in 2017, the site now forms part of the UK’s commitment to the EU funded Integrated Carbon Observation System (ICOS). This is a pan-European Research Infrastructure that provides very high quality, harmonised data on the cycles of carbon and other greenhouse gases. Through ICOS Weybourne has been at the forefront of instrument testing and has been fundamental in getting the FTIR instrument approved on the network.
As well as being part of the ICOS network and part of the Defra ozone network (AURN), Weybourne has been / is part of the Defra TOMPS network (atmospheric toxic organic samplers), a Defra CH4 network, the EU InGOS network (Integrated non-CO2 Greenhouse gas Observing System) and is now contributing measurements to the NERC funded MOYA and DARE-UK projects.
Many successful campaigns have been hosted at WAO to examine oxidizing capacity, organic chemistry, carbonaceous particles, night-time chemistry and cloud impacts on radiation. The site is also used by the wider community for instrument testing.
This site is owned and operated by UEA and they run a range of instrumentation – see the community operated instruments section for details.
View near real time data →
Observatory operational status: instrument by instrument break down of instrument performance.
This AMOF gas-phase instruments at this site measure the following species
- methane (CH4)
- carbon monoxide (CO)
- carbon dioxide (CO2)
- hydrogen (H2)
- nitrous oxide (N2O)
- oxygen (O2)
- sulfur hexafluoride (SF6)
Meteorological parameters are
- Wind speed and wind direction,
- Temperature
- Relative Humidity
- Pressure
- Irradiance
- Profiles of the aerosol backscatter coefficient
- Number of cloud layers
- Cloud layer base height
- Wind profiles (400m)
Additional measurements (see community-operated instruments)
- CO2 isotopes (13C and 18O)
- CH4 isotopes (13C)
- nitric oxide (NO)
- nitrogen dioxide (NO2)
- ozone (O3)
- sulfur dioxide (SO2)
- Particulate matter (PM1, PM2.5, PM4, PM10, Total Suspended Particles)
- Low level radon
- VOCs and OVOCs (available upon request)
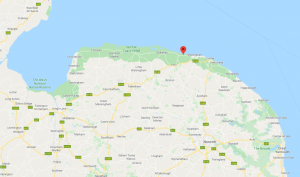
WAO is on the North Norfolk coast (52º57’02’’N, 1º07’19’’E, 15 m asl). It is a highly secure facility accessed through the Muckleburgh Military Collection at Weybourne, North Norfolk.
The distance of the site from the mean tide line is approximately 100 m
Weybourne receives air predominantly from across the Atlantic and from North-Western Europe.
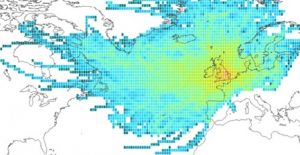
Relative frequency at which 5-day back trajectories passed over each 1x1ogrid cell before arriving at Weybourne (2000-1): red high frequency – blue low frequency.
The predominant wind directions are the south and west wind sectors as defined in the map.
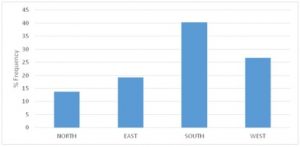
Predominant wind direction received at WAO from 2006-2012 (Mann, 2014).
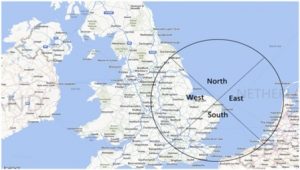
Wind sectors for Weybourne Atmospheric Observatory. Created with Bing Maps as an image (Mann, 2014).
Southerly flow is dominant all year round but tends to occur more frequently in the autumn. Westerly flow occurs most often in the winter, and less often in the summer. Easterlies tend to occur most often in the spring, and least often in the autumn. Northerlies are the least common but mostly occur in the summer and least likely in the winter.
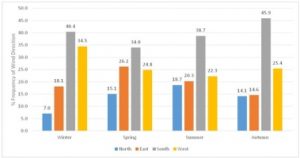
The frequency of wind directions at WAO as a function of the season from 2006-2012 (Mann, 2014).
The average wind speeds tend to be highest from the north and west sectors.
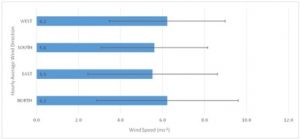
Average wind speeds (m s-1 ± standard deviation error bars) corresponding to the wind directions received at WAO from 2006-2012 (Mann, 2014).
Using the Met office NAME dispersion model Zoë Fleming (NCAS at the University of Leicester) has generated footprint plots on 3-hourly intervals, which illustrate where air arriving at WAO is mostly likely to have been close to the surface over the previous 10 days.
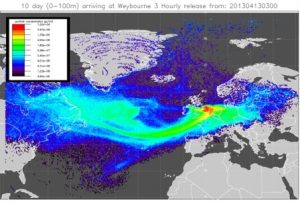
Example NAME footprint for WAO.
These footprints are created by model runs in which thousands of particles are released from the location of WAO and tracked backward in time. By examining the number of particles and the time they have spent close to the surface in defined regions we can quantify the expected influence of these regions on the air observed at WAO.
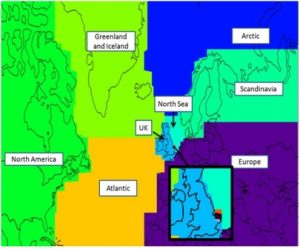
Defined regions for the NAME analysis. Local sectors defined as 0.5°E to 2°E and 0.5° from the coast northwards (marine) and 0.5° from the coast southwards (land) are shown in the zoomed inbox.
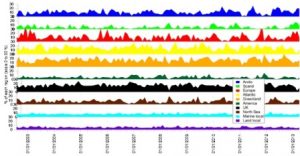
Influence of each region on the air observed at WAO on a monthly basis from 2002-2013
Clearly WAO is influenced by air that has been in the boundary layer over a number of different regions, in particular the UK, Europe, the Atlantic, Greenland and the Arctic. The influence of some regions tends to vary with season. E.g. Air from Europe tends to be more frequent in the winter than summer, whilst air from the Arctic is more frequent in the summer than in the winter.
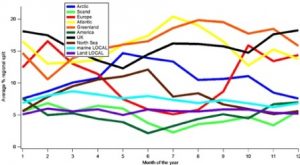
Monthly averages of the percentage influence of each region over the years 2002-13.
To examine the impact of the different regions on trace gas concentrations each footprint has been categorised by the dominant region. Although the NAME analysis suggests that for a lot of the footprints many of the particles have spent a considerable amount of time over the Atlantic and Greenland, these particles are often calculated to have passed through the boundary layer of regions much closer to WAO. For relatively short-lived gases, the emissions from the near-field regions are therefore likely to dominate. Each 3-hourly footprint was therefore assigned to one of 4 regions (UK, Europe, UK and Europe, and Arctic (and Greenland) illustrated below, if at least 10% of the footprint density was in that region. Footprints that did not qualify were assigned to “Mixture”.
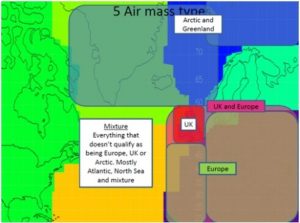
Regions for categorising each NAME footprint.
At least 50% of the footprints were assigned to the UK and a further 30% of the footprints were assigned to either Europe or the UK and Europe combined. This indicates that much of the air arriving at WAO is expected to have been recently impacted by emissions.
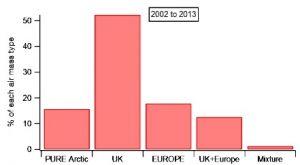
Percentage of NAME footprints assigned to specific regions fro 2002-13.
Air influenced by the UK was found to have lower ozone mixing ratios, whilst are from the Arctic tends to have the highest ozone mixing ratios. Air from Europe tends to have the highest NOx mixing ratios.
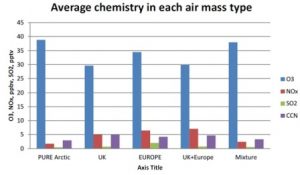
Average chemical composition (2002-13) of air observed at WAO with footprints assigned to specific regions.
The wind sector analysis also shows that the ozone in air coming from the east exhibits greatest variance, with both very high (> 60 ppb) and very low (< 15 ppb) mixing ratios, whilst air from the north rarely has less than 25 ppb and air from the west rarely exceeds 45 ppb.
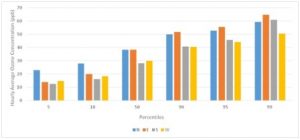
Hourly average ozone concentration (ppb) percentiles, coupled to wind direction at WAO over the period 2006-2012 (Mann, 2014).
Ozone at WAO exhibits a strong seasonal cycle, with a spring maximum and winter minimum. Superimposed on this are elevated ozone episodes in the summer and periods of near-zero ozone in the winter.
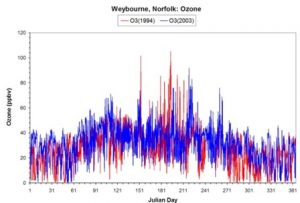
Hourly mean ozone mixing ratios (ppb) for 1994 and 203 at WAO.
The long term record at WAO suggests that the lowest ozone mixing ratios (5th percentiles) have increased (i.e. a reduction in the high NOx titration events), whilst the highest ozone mixing ratios (95th and 98th percentiles) have decreased (i.e. a reduction in the elevated ozone episodes).
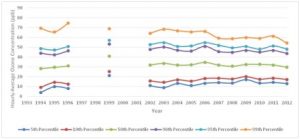
Hourly average ozone concentration (ppb) percentiles over the period 1993-2012 at WAO (Mann, 2014).
This is further illustrated by a general decline in the number of hours in which ozone mixing ratios exceed 60 ppb.

The frequency at which ozone concentrations exceed 60 ppb at WAO in spring (blue) and summer (red) from 1993-2012(Mann, 2014).
NOx also shows a strong seasonal cycle with highest values in winter and autumn and lowest values in summer.
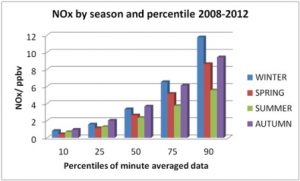
Hourly NOx concentration (ppb) percentiles as a function of the season at WAO averaged over the period 2008-2012.
Reference
- Mann, R., “Ozone trends on the North Norfolk coast”, BSc Natural Science Degree Project Thesis, University of East Anglia, 2014.
Compiled by Claire Reeves with the NAME analysis contributed by Zoë Fleming.
Note
- 10 day footprints on a 3 hourly basis are available on BADC from August 2002, along with regional analysis plots and time series where each footprint as flagged as being one of the 5 air mass types (Arctic, Europe, UK, Europe+UK and mixture).
Virtual Tours
Space
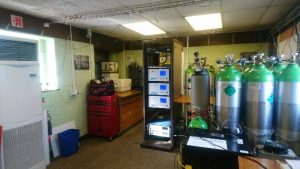
- The site consists internally of two air-conditioned laboratories and an office which presently houses our computing capability.
- There is space in the larger laboratory to house freestanding instrumentation or 19” rack-mounted instrumentation and bench space.
- Freestanding instrumentation can be facilitated within the grounds or on our building accessible flat roof space.
- Weather proof cabinet on the roof to allow instrument installation on the roof
Power
- The site has abundant power capability and allows for numerous instrumented sea containers with air conditioners to be positioned on the hard standing adjacent to our main building.
- External instrumentation can be powered by external 13 amp sockets or via 32 amp and 16 amp supply using weatherproof IP66 style connection.
- There is the capability to utilise three-phase supply if required. In the past, the facility has been powered up to 70 amps per phase.
Services
- Fast fibre broadband internet.
- Hot and cold water.
- Kitchen and coffee making facilities.
- Toilet facilities.
- Gas store – BOC makes regular deliveries and collections to and from the site.
- Electronic and IT support can be sourced via UEA. However, an extra cost may be required to facilitate this.
- Full range of tools to help facilitate maintenance and installation of equipment.
- Two 10m high tilt masts on site to hold sampling tubing and equipment which needs to be installed in situ (e.g. wind sonic). Therefore no working at height regulations associated with installation.
- Recirculating fume hood.
- Flammable and oxidising chemical storage.
- Laboratories are monitored with IP webcams for offsite peace of mind.
It takes 45 minutes to drive to the site from Norwich International Airport, and approximately 1 hour from the University of East Anglia. Travel via public transport is also an option.
There are numerous hotel and bed and breakfast options available locally. The quite villages of Kelling and Weybourne are within a 20 minute walk of the observatory. The market town of Holt and the coastal town of Sheringham are within a 10 minute drive of the observatory.
Some suggestions.
The Pheasant Hotel in Kelling is within a 20 minute walk from the observatory. https://www.pheasanthotelnorfolk.co.uk/
The Kings Head B&B and restaurant is situated in the market town of Holt which is approximately 10 minutes by car. https://www.kingsheadholt.org.uk/
The Weybourne Atmospheric Observatory operates under conditions that are subject to the Health and Safety at Work Act. It is essential that each individual working at Weybourne makes safety their first priority.
Users must complete the necessary Health and Safety Forms (i.e. Risk Assessments, COSHH assessments) dealing with individual activities before any person is allowed to work at Weybourne. These risk assessments and COSHH must be approved by the station manager. In addition any users of the observatory must familiarise themselves with the facilities risk assessment and must complete a safety induction.
The following potential risks have been identified as possibly being present at Weybourne They may not be exhaustive and “common sense” should prevail on site.
Vehicle Access
- The public road system has speed limits of 60 mph, 30 mph and 20 mph.
- The private road system has a maximum speed limit of 5 mph.
- Some of the roads are not tarmac, please proceed with caution.
- It is essential to adhere to the speed limits.
- The private road system is also used by private military vehicles – please give way to them.
- It is essential at all times to keep vehicles on the track provided and not to stray on to adjacent land. This is particularly true of the airstrip.
- Notices are provided to indicate the location of the airstrip and the need to avoid driving vehicles on to it.
Electrical
- No overloading power sockets.
- All electrical equipment must be PAT tested.
- Comprehensive testing of all the electrical services: internal and external, at WAO has been performed in 2018 and is repeated every 5 years.
Tilt masts
- Only designated persons will be allowed operate the tilt masts. These persons will usually be employed by the University of East Anglia.
Observatory Roof area
- Accessible via staircase.
- The area is surrounded by a safety rail.
Observatory Building
- Access to the laboratory will either be through the door to the office/mess room or through the external doors to the laboratories
- Fire Risk
- Increased Security at the site has meant the provision of metal bars at the windows. This means that egress cannot be via the windows in the event of an emergency evacuation.
- Please ensure that the doors to the facility are unlocked during work periods thus ensuring an effective escape route from wherever on-site
- Security keys are positioned at every exit, thus enabling rapid exit if required
- Foam extinguishers are available in each room.
- Things to consider when assessing the risk or the activity
- Electrical Instrumentation. A trained electrical technician must be onsite if any electrical work is required.
- High-pressure gas cylinders must be moved using a cylinder trolley and by people trained personnel.
- All gas cylinders must be securely held in place.
- Chemicals must be labelled and all COSHH must be in place before any work can proceed.
- Chemicals must be stored appropriately.
- Radiation risks must be fully assessed and the activity approved by the UEA Radiation Officer.
Consumables
- If bringing in additional instrumentation then all consumables and tools for that instrumentation should be provided.
Costs
- Instrument Insurance
- The user must have comprehensive insurance for any kit they bring.
- Public Liability Insurance
- The AMOF is not liable for any damage or injury arising from the deployment or operation of this instrument when unattended by the instrument scientists.
- Gas Consumption
- The delivery and provision of gases can be arranged by the facility However, this will be chargeable.
- Use of AMOF Personnel
- There will be a cost for this. Please contact Instrument scientist for more details.
Shipping
- The user is liable for all costs arising from the shipping of any instruments both to and from WAO.
As the facility is not permanently manned any user organised deliveries will need to be arranged directly with Dr Grant Forster.
The facility is accessed via the Muckleburgh Military Collection from the coast road between Kelling and Weybourne on the A149. The main gate of the collection is locked after 16:40 daily, but key access can be arranged.
Further security is provided by a number coded padlocked gate that is found once through the Muckleburgh site. The cylinder store is likewise protected by a number coded padlock. All of the information needed to access the facility is provided during the Weybourne Induction training.
Lone working is discouraged at the site and policies should be in place to enable a safe working environment should personnel find themselves alone on site. We operate a “buddy” system which is described in more detail in during the Induction training.
There are no user configurable instruments at this site
Gill MetPak integrated weather station: wind speed, wind direction, temperature, relative humidity and pressure.
T500U CAPS NO2 Analyzer: nitrogen dioxide (NO2)
Thermo Scientific Model 42i Analyzer: nitric oxide (NO) and nitrogen dioxide (NO2)
Thermo Scientific Model 49 Ozone Monitor: ozone (O3)
Thermo Scientific™ Model 43i SO2 Analyzer: sulfur dioxide (SO2)
FIDAS 200: particulate matter (PM1, PM2, PM4, PM10, Total Suspended Particles)
ANSTO 1500L low level radon detector: atmospheric radon.
SODAR PCS.2000: vertical profiles of wind and turbulence, monitors inversion layers and derives stability classes in height ranges 15 m to ≥ 1000 m.
Proton Transfer Reaction Mass Spectrometer: Oxygenated Volatile Organic Compounds (OVOC’s, e.g. methanol, acetone, isoprene) and VOC’s. Available on request.