
Instrument Support Level 3
CO2: Siemens, Ultramet 6E, O2: Sable Systems, Oxzilla II
Not Applicable
Calendar
O2 and CO2
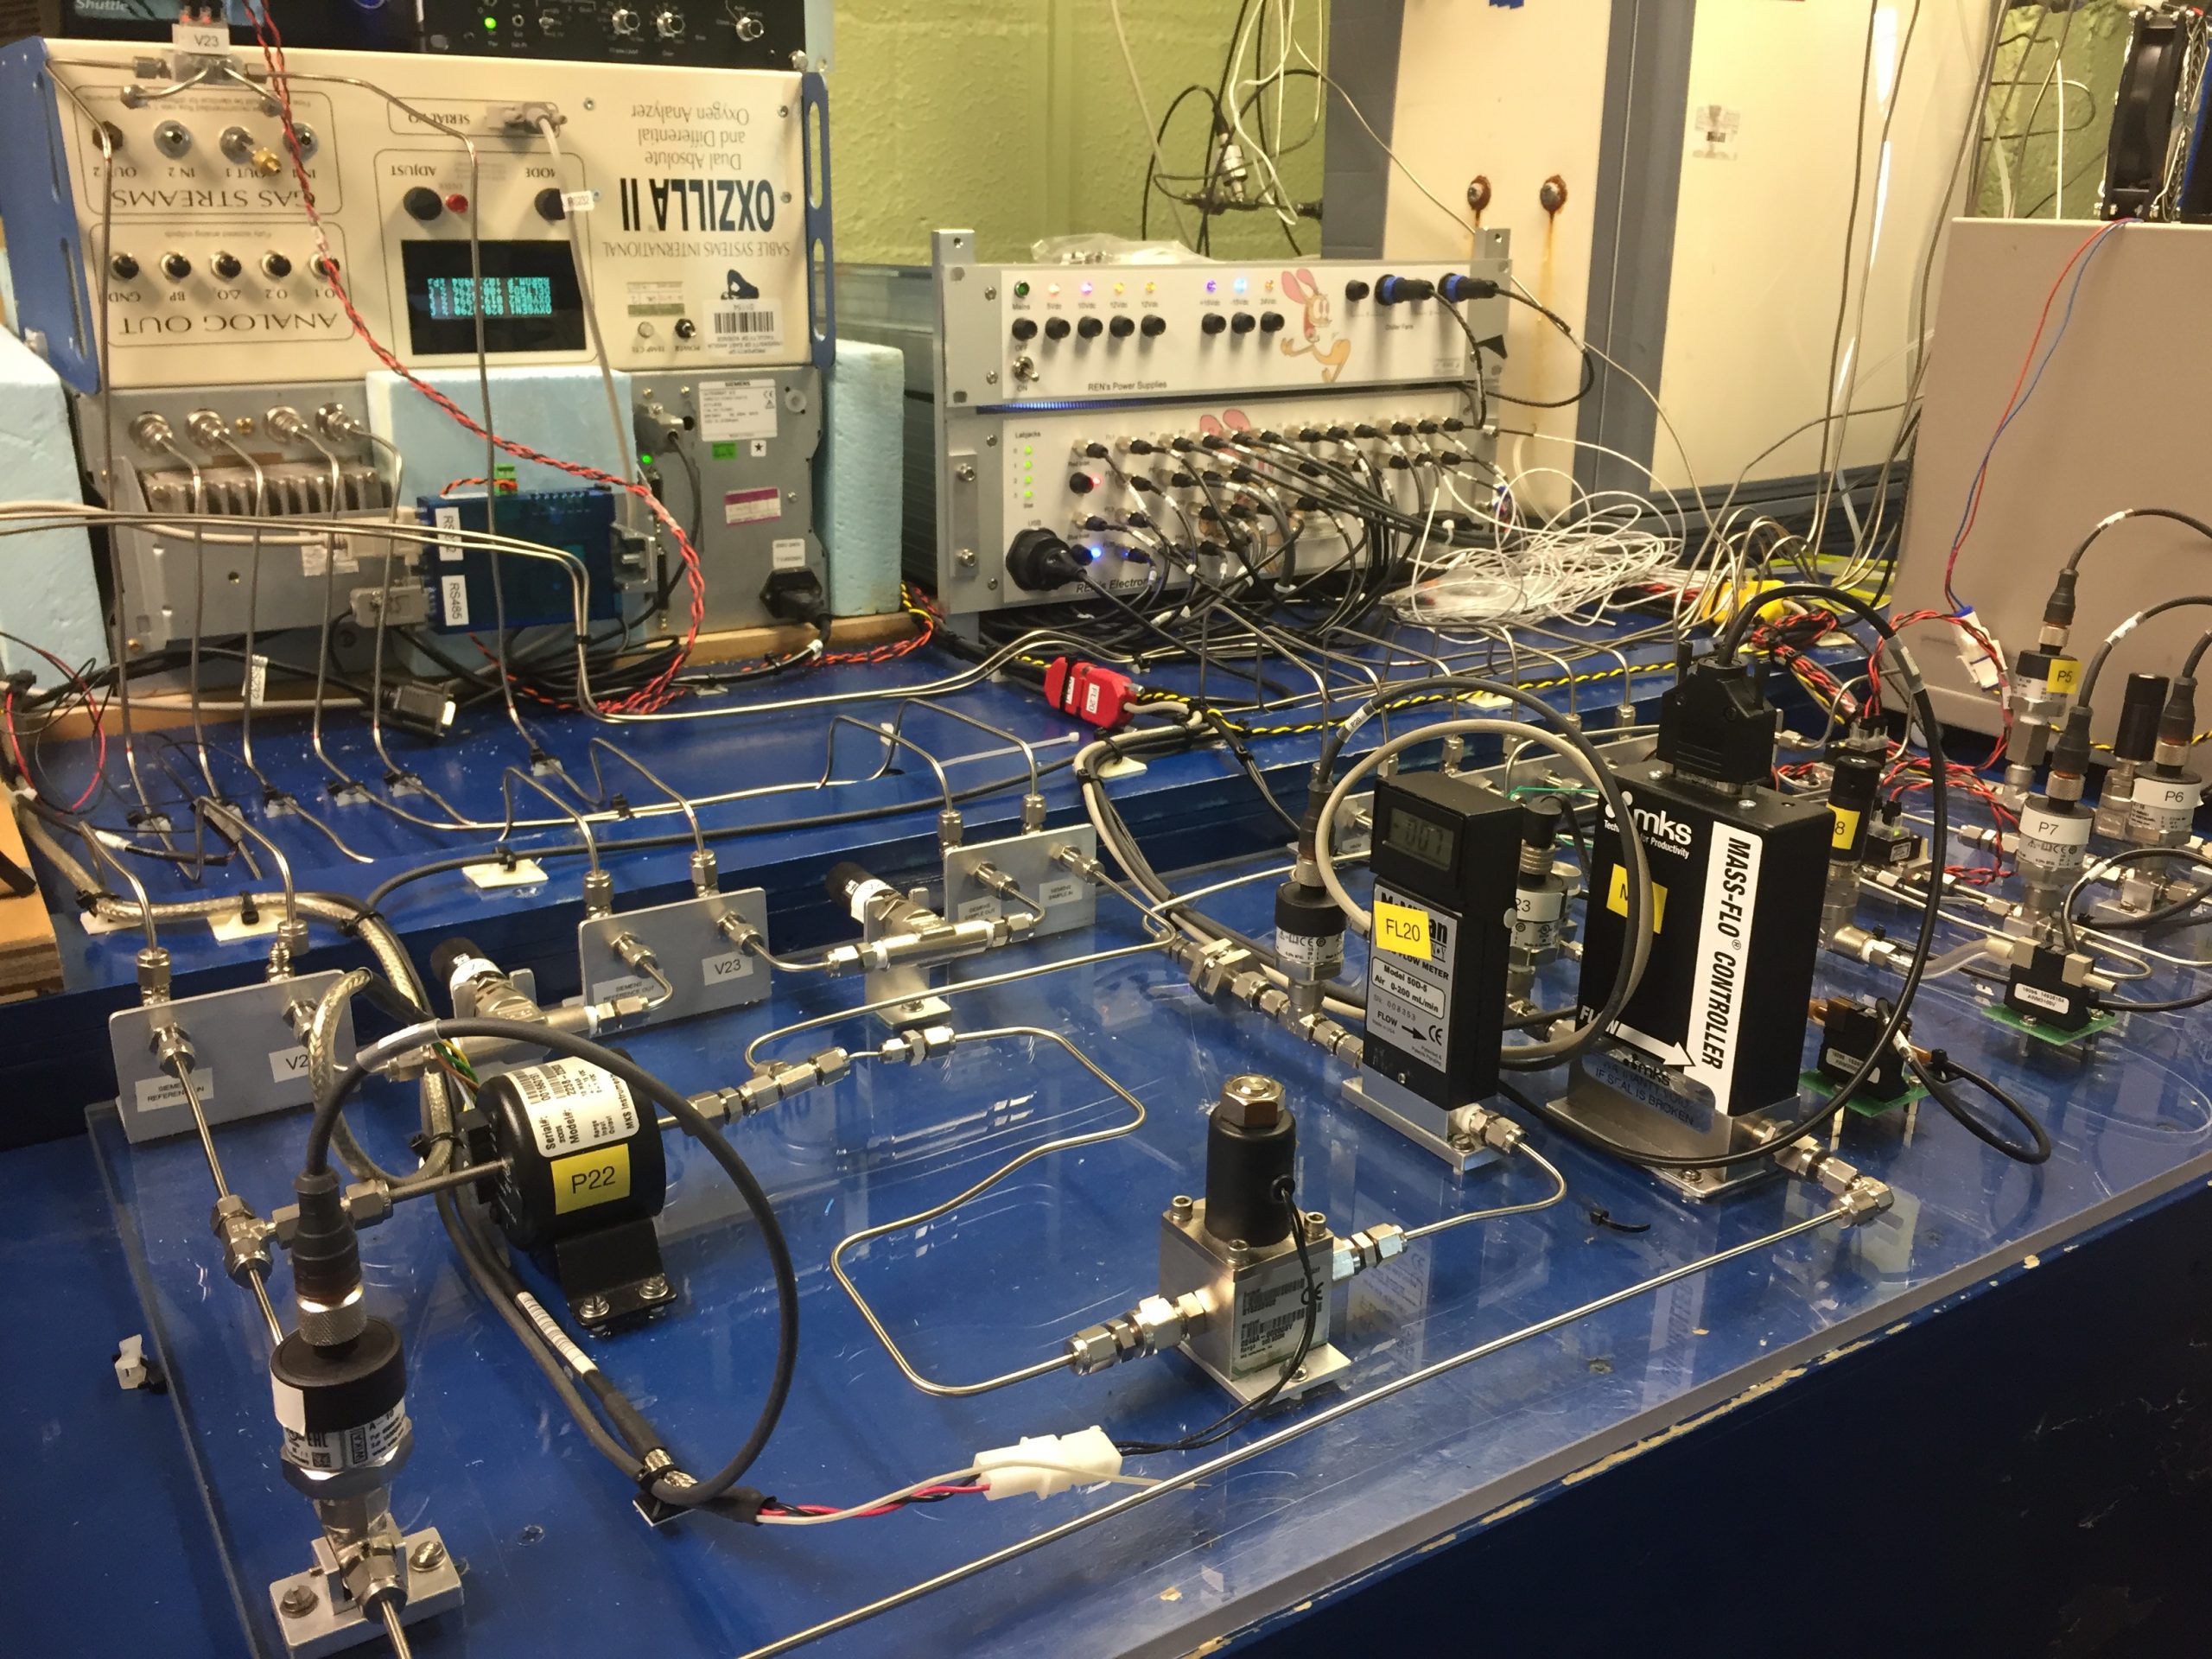
A single gas handling system is used to measure carbon dioxide (CO2) and molecular oxygen (O2) concurrently in a single contiguous system including both analysers. Air is sampled from an aspirated inlet on the 10 m tower at Weybourne using a diaphragm pump.
A two stage drying system is employed and a pressure control interface is used to match the flows of both sample and reference flows upstream of the analyser.
All calibrations and outside air measurements are performed against a reference flow of dry cylinder air to improve sensitivity.
The CO2 analyser is a Siemens Ultramat 6E non-dispersive infra red (ND-IR) CO2 analyser.
After passing through the Siemens CO2 analyser the airstream is analysed for O2 content using an Oxzilla II analyser from Sable Systems that utilises fuel cell technology.
The data for both species is reported on the same timestamps.
The Siemens Ultramat 6E analyser has a sample and reference measurement cell, each with a volume of 88 mL. The difference between the infrared (IR) absorption of the sample and reference air is measured and converted to a CO2 mole fraction based on the regular calibration procedures carried out that establish the analyser’s response function. The IR absorption of sample and reference are measured in quite a novel manner in the Siemens analyser; two sealed detector cells containing pure CO2 are located behind the sample and reference cells, and are connected to each other by a capillary tube with a microflow sensor. The CO2 in the detector cells absorbs all of the IR radiation that passes through the sample and reference cells. The difference in the transmitted IR due to the difference in CO2 mole fraction in the sample and reference cells causes the two detector cells to increase in temperature differentially. The temperature difference between the two detector cells results in a pressure difference that in turn causes a very small flow between the two detector cells through the capillary tubing connecting them. This flow is measured by the microflow sensor, and is proportional to the difference in CO2 mole fraction between the sample and reference cells.
O2 measurements are performed using an Oxzilla II (Sable Systems Inc.) analyser that employs fuel cell technology to measure O2 concentration. The fuel cells contain a weakly acidic electrolyte solution isolated from the air stream by a semi-permeable membrane. Air diffuses across the membrane, and within the fuel cell the following electrochemical reaction takes place:
O2 + 4H+ + 2Pb → 2H2O + 2Pb2+
The lead atoms are supplied by the anode, the protons from the electrolytic solution and a gold cathode completes the cell. The resultant change in potential difference across the cell is measured and this is proportional to the rate at which O2 diffuses across the membrane and therefore also to the partial pressure of O2 in the air stream. Samples are always measured as a difference from the reference air being measured concurrently in the other cell. The sample and reference air streams are swapped to the alternate cell, via a 4-way valve every 60 seconds, with the first 30 seconds of measurement after each valve switch being discarded. The switching eliminates most of the drift that the individual fuel cells’ responses may experience on timescales longer then the switching interval, 60 seconds. This valve switching also has the beneficial advantage of doubling the sensitivity of the measurement.
Sampled air is dried in two stages; firstly liquid water is removed by a peristaltic pump as the air passes through two glass fridge traps at 1-2 °C, then the air is passed through two stainless steel chiller traps immersed in an ethanol bath at around -90 °C freezing out the remaining water and achieving a very low dew point.
The flows of sample and reference air are matched by ensuring that the pressure drops in both lines are identical using a Baratron 223B differential pressure gauge from MKS instruments
The response of the Siemens analyser is non linear to CO2 mole fraction and so a quadratic calibration curve of the form: y = ax2 + bx + c is adopted. To define the parameters of the calibration curve (a, b and c) three calibration standards were used for the period 2007 – 2014 and four standards are used from mid 2014 onwards. A calibration is performed every 47 hours and the calibration cylinders’ concentrations are on the WMO defined scale for CO2: the NOAA X2007 scale
A further calibration cylinder is run much more frequently than the multi point calibrations and is used to correct for baseline drift in the CO2 calibration curve. Baseline drift is typically much more variable than span or non-linearity drift, and is usually caused by external factors such as ambient temperature variability. The cylinder is run immediately after the three point calibration to establish an initial baseline response and it is subsequently run every 3-4 hours to redefine the baseline analyser response; any change from the initial baseline response is assumed to be owing to analyser drift and the magnitude of this change is applied as a correction to the c-term of the calibration curve for CO2 (the c-term or intercept is most susceptible to any drift in detector response).
The response of the Oxzilla analyser is highly linear to O2 mole fraction and so a calibration curve of the form: y = mx + c is adopted. Three calibration standards were used for the period 2007 – 2014 and four standards are used from mid 2014 onwards. A calibration is performed every 47 hours and the calibration cylinders’ concentrations are on the WMO defined scale for O:2 the SIO S2 scale.
A target cylinder of known concentration is run every 8-9 hours to check the performance of the system.
All cylinders are stored horizontally in a thermally isolated box as this has been shown to minimise fractionation of gases within the cylinder that can adversely impact the precision of the measurements
Archive Data
- Data is provided in NetCDF files following the AMOF data standard
- Files contain no more than 24hr of data.
- Instrument name is
- ncas-co2-1
- ncas-o2-1
- The data product(s) associated with this instrument:
- Example data file
Data is also available through
- World Data Centre for Greenhouse Gases
- Available as a NOAA Observation Package (ObsPack) Data Product