
Instrument Support Level 3
Dantec
Not applicable
Calendar
Cold Wire Thermometry
The cold wire is basically a standard Dantec hot wire probe that is run in a constant current mode of around 1mA. Since this is not enough to heat the wire significantly it is referred to as a cold wire.
The circuitry to do this has been built in-house by Paul Nathan.
This instrument gives a voltage output proportional to temperature with a frequency response of a few kHz. We place a small thermistor close to the probe to calibrate it and also to measure the mean temperature, whilst using the cold wire to give us the fluctuating temperature.
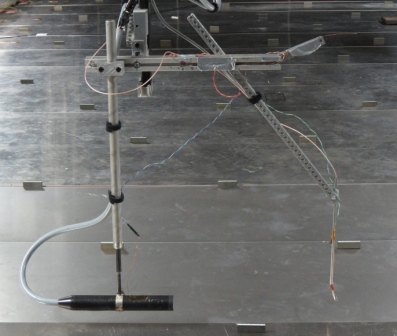
We usually use the cold wire in conjunction with the LDA system to be able to measure heat flux ut, and wt using a setup like this.
A very small constant current of 1mA is applied to a 5 micron wire that is about 1mm long and has a resistance of around 5 ohms. Since power is I^2*R the heating effect on the wire is minimal (5 micro Watts) therefore the wire temperature assumes that of the surrounding air. The voltage across the wire is proportional to the resistance of the wire, which is proportional to the temperature of the wire. This very small voltage is amplified to give an output voltage that is linearly proportional to temperature.
The voltage output from the cold wire circuit is calibrated for temperature against the adjacent thermistor using a linear fit.
Field Data
- The instrument produces a range of out files and all are text format.
- The user can download (but not delete) this data from the instrument but it should be noted that this data will not have been quality controlled.
- Data from the LDA system is logged using the EnFlo Software which is our inhouse code written in Labview. The time series for each measurement position is saved in a separate file know as the “Raw data file” and is in binary format. If you want to take away times series of your data, you can post process these “Raw data files” using EnFlo_Software and output the “Time series” for the desired instruments in text tab delimited format. Statistics for each measurement point are stored in “Results files” with names chosen by the user are in text tab delimited format, so can easily be viewed with a spread sheet program such as Excel. If multiple points are specified to log into the same “Results file” each point appends to the existing file growing the number of rows in the spread sheet file. Columns of Metadata appear in the “Results files” so the reference velocities and temperatures etc. are logged with the LDA Velocity statistics. Currently there are around 400 channels of metadata that are added some of which are more applicable than others to any given experiment. The user can use EnFlo Software to create a “Templated files” so just the channels of interest to a given user can be output together with any additional calculations into a text tab delimited file.
Archive Data
- Instrument name is
- Under development
- The data product(s) associated with this instrument:
- Under development