
Instrument Support Level 3
Thermo Scientific 49i Ozone Monitor
Not Applicable
Calendar
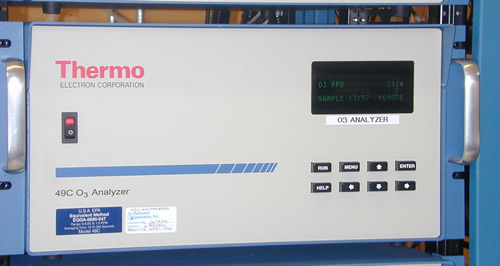
TECO 49i Ozone Monitor
The Model 49 is a powerful, easy-to-use, UV photo-metric based ozone analyser which offers increased specificity via its balanced optical system. User programmable software capabilities allows selection of the frequency at which internal zero/span activation and instrument calibration checks will occur. Additionally, field programmable measurement range settings can be stored in memory for subsequent recall.
Extended troubleshooting diagnostics now provide instantaneous indication of instrument operating parameter, status including: Pressure, Flow, DC Supply Voltages, Optical Bench Temperature, Ozonator Power Supply Voltage and Lamp Voltage.
The 49 Series Ozone Analysers are based on the principle that ozone molecules absorb UV light at a wavelength of 254nm. The degree to which the UV light is absorbed is directly related to the ozone concentration as described by the Beer-Lambert Law:
I/I0=e-KLC
where:
K = molecular absorption coefficient, 308 cm-1 (at 0°C and 1 atmosphere)
L = length of cell, 38 cm
C = ozone concentration in parts per million (ppm)
I = UV light intensity of sample with ozone (sample gas)
I0 = UV light intensity of sample without ozone (reference gas)
The sample is drawn into the instrument through the sample bulkhead and is split into two gas streams. One gas stream flows through an ozone scrubber to become the reference gas (I0). The reference gas then flows to the reference solenoid valve. The sample gas (I) flows directly to the sample solenoid valve. The solenoid valves alternate the reference and sample gas streams between cells A and B every 10 seconds. When cell A contains reference gas, cell B contains sample gas and vice versa.
The UV light intensities of each cell are measured by detectors A and B. When the solenoid valves switch the reference and sample gas streams to opposite cells, the light intensities are ignored for several seconds to allow the cells to be flushed. The instrument calculates the ozone concentration for each cell and outputs the average concentration to both the front panel display and the analog outputs.
UV photometry is the recommended primary calibration procedure.
This instrument is almost always run alongside a second duplicate instrument. Two independent ozone instruments agreeing within 3% can replace the need for frequent calibrations.
A transfer standard (CVTS), 2B model 606, is used to calibrate the ozone instrument and this is done every 3-4 months during routine maintenance trips to the Cape Verde Atmospheric Observatory. The CVTS is checked against the NIST calibrated transfer standard (TS) and brought in-line with it before and after each Cape Verde trip.
The TS (Transfer Standard – TS Model 49I-PS S/N: 0703820627) is held at the COZI-Lab, University of York, and is itself calibrated annually using the primary standard reference photometer #2 (SRP #2) from the National Physical Laboratory (NPL) (traceable through the National Institute of Standards and Technology (NIST). 3% uncertainty is acceptable for reference to standards e.g. to the SRP.
The instrument zero should be checked every month using an external scrubber (activated charcoal) on the inlet (20 minutes with the last 10 minutes of data being used) and as part of the calibration procedure. Results from this are recorded but the instrument is not rezeroed unless it is clear that there is a problem with the instrument, i.e. if the standard deviation of the zero data is large.
The standard difference between two SRPs measuring zero air should not exceed (root 2 x 0.25 ppbV) = 0.49 ppbV (1 sigma), 1 minute averaging time.
Since it is an absolute measurement technique, the accuracy of the instrument is purely determined by the random error (or precision) and there is no assumed systematic error. The routine zero data (1 minute) is used to calculate the error on the data (√2σ) and if this is > 3 ppbV for minute data then the data is flagged.
To give the precision for hourly averaged data (√2σ)/ (√60).
Instrument parameters (e.g. cell intensities, temperatures, flows) are logged alongside those of the concentrations and used to diagnose problems.
The ozone measurements are fully traceable to the international Global Atmospheric Watch (GAW) scale (NIST Standard reference photometer SRP#2). This means that the ozone photometer used to generate ozone for the calibrations is referenced to a photometer held at NIST. To ensure this is upheld, the designated world calibration centre for Ozone (WCC-Empa) carries out regular audits of the measurements using travelling photometers.
Near real-time hourly averaged carbon monoxide data (within 3 days) is submitted to the MACC project, where it is used to evaluate the global model performance. Modelled gas concentrations are validated with the surface in-situ measurements.
In order to compare modelled and observed values, modelled concentrations of CO (and O3) at the stations’ location are interpolated linearly from the model gridded data in the horizontal domain. In the vertical, modelled gas concentrations are extracted at the model level that matches the Global Atmospheric Watch (GAW) stations’ real altitude. This is equivalent to matching the mean pressure of model level and the ground station.
The comparison of surface in-situ data with global model output comprises several issues of representativeness: In the horizontal scale, the estimation of errors is rather uncomplicated. In the vertical scale, however, representative matching of measured and modelled values remains critical. Especially for mountainous stations, the chosen model level (matching the GAW station’s real altitude) may lack topographic effects. Generally, stations in flat terrain are less critical.
For evaluation of model performance, scores for the displayed period are printed on top of each figure.
Currently, the online validation service operates with 12 GAW stations, which are delivering hourly data of tropospheric CO and O3. The data are preliminary and have not been extensively quality checked.
Field Data
- The instrument produces a range of out files and all are text format.
- The user can download (but not delete) this data from the instrument but it should be noted that this data will not have been quality controlled.
Archive Data
- Data is provided in NetCDF files following the AMOF data standard
- Files contain no more than 24hr of data.
- Instrument name is
- ncas-49i-o3-1
- The data product(s) associated with this instrument:
- Example data file