
Instrument Support Level 3
Cambustion, HFR400
Not Applicable
Calendar
4 Channel Hydrocarbon Concentration Analyser
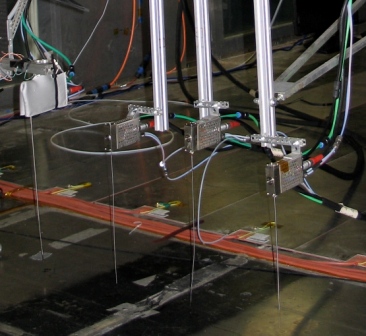
Dispersion experiments are carried out in the wind tunnel by releasing a source gas of say 2% propane in air and then measuring the hydrocarbons at the receptor location using a Fast Flame ionisation detector (FFID). These detectors typically measure between 1000 parts per million by volume (ppm) down to about 0.05ppm. So if the source is 2% propane in air, (20,000ppm) the dilution ratio that the source can be detected down to is 1:400,000. The EnFlo lab has 4 FFIDs (sample heads) so concentration time traces can be obtained at 4 locations in the tunnel simultaneous.
The frequency response of the FFID is around 200Hz. By mounting the FFID on the traverse, vertical and spanwise concentration profiles can be measured. Sometimes a single FFID is used in conjunction with the laser Doppler anemometer to obtain turbulent concentration flux uc and wc.
The Fast Flame Ionisation Detector (FFID) has a flame that runs on the fuel gas and air in a chamber that runs below atmospheric pressure. The sample gas is drawn into this chamber up the sample capillary since it is below atmospheric pressure, and any hydrocarbons in the sample are burnt, producing ions. These ions are attracted to the high voltage ion collector, and the current seen at the collector is proportional to the number of hydrocarbons in the sample. This very small current is then amplified and output as a DC voltage from 0-10volts where it can be logged by the data acquisition software.
Total of four channels
- Instrument Model HFR400 supplied by Cambustion Ltd
- FID Fuel: 40H2 in He
- Chamber pressure typically between 100 and 250 mmHg below atmospheric pressure
- Frequency response ~200Hz
- Sample head must be held upright (sample tube exiting the bottom of the flame chamber)
- Sample tube length is typically 300mm
Delay time ~ 25ms important to remember when synchronising with the LDA - Certificated Calibration gases: typically 750ppm and 150ppm
- Initial temperature stabilisation time approx. 1 hour
Recommended Calibration interval 1 to 2 hours
Recommended Background check interval 10 to 15 minutes
The Fast Flame Ionisation detectors are calibrated by immersing the sample tube in a stream of air released from the calibration stack containing a known ppm of propane.
 We purchase certificated cylinders having nominal values of 750ppm and 150ppm propane in air and produce our own “zero ppm” air using an air purifier. This enables us to do a 3 point calibration, to which we fit a second order polynomial, but the software checks that the resulting calibration is very close to linear.
A computer controlled valve is used to select which calibration gas is supplied to the calibration stack so that the calibration can be automated. We aim to obtain between 5.5 and 7.5 volts output for 750ppm.
When the FFIDs are mounted on the traverse system the sample tube can be moved into the calibration stack, where a 3 point calibration can automatically be performed. Each new calibration is compared to the previous one to determine the % drift in the FFID’s calibration. Typically this value of drift would be less than 1%. If the drift is above 1% the system will email the user so the problem can be investigated.
Background Measurement
At regular intervals (eg. every 12 minutes) the concentration in the air before the release is added needs to be measured so that this can be subtracted from the sample measured in the plume. This is either done by diverting the flow away from the release point or by moving the FFID to a location in the tunnel where it is known that there is no source contamination and taking a background measurement.
Spike Removal
It is necessary to remove spikes from the time traces, as they can be very large relative to the concentration signal. If there is as spike in the data that is more than 6 standard deviations above the mean value and also is of duration 10ms or less the EnFlo software replaces it with the mean value of the concentration before and after the spike. In the example shown the data rate was taken at 1500Hz so large spikes of up to 15 points (10ms duration) will be removed. The software records in the “Results file” the number of spikes that have been removed from the total time trace for that measurement location.

Field Data
- The instrument produces a range of out files and all are text format.
- The user can download (but not delete) this data from the instrument but it should be noted that this data will not have been quality controlled.
- Data from the FFID system is logged using the EnFlo Software which is our inhouse code written in Labview. The time series for each measurement position is saved in a separate file known as the “Raw data file” and is in binary format. If you want to take away times series of your data, you can post-process these “Raw data files” using EnFlo_Software and output the “ spreadsheetFFID_Time Series ” for the desired instruments in text tab-delimited format. Statistics for each measurement point are stored in “ spreadsheetFFID_Results file ” with names chosen by the user are in text tab-delimited format, so it can easily be viewed with a spreadsheet program such as Excel. If multiple points are specified to log into the same “Results file” each point appends to the existing file growing the number of rows in the spreadsheet file. Columns of Metadata appear in the “ spreadsheetFFID_Results file ” so the reference velocities and temperatures etc. are logged with the FFID concentration statistics. Currently, there are around 400 channels of metadata that are added some of which are more applicable than others to any given experiment. The user can use EnFlo Software to create a “ spreadsheetFFID_Templated_File ” so just the channels of interest to a given user can be output together with any additional calculations into a text tab-delimited file.
- It is recommended to post-process the FFID raw data files since EnFlo _Software makes use of the calibrations before and after the measurement point to do a linear correction in time for any drift that occurred. It also does a linear correction in time using the background values taken before and after the measurement point.
Archive Data
- Instrument name is
- Under development
- The data product(s) associated with this instrument
- Under development