Instrument Support Level 3
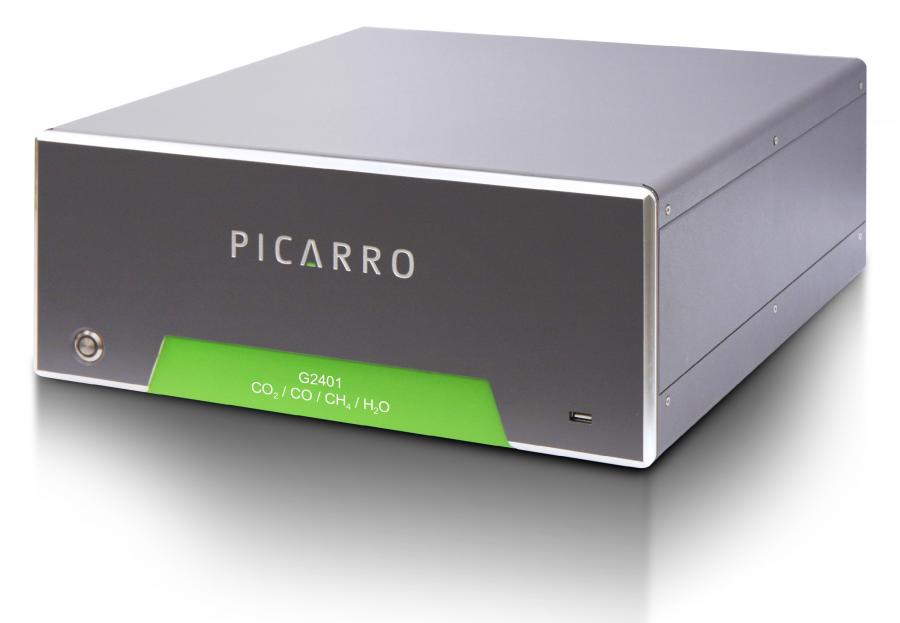
Picarro Model G2401 CO, CH4, CO2, H2O Analyser
Not Applicable
Calendar

Picarro CO Monitor
Simultaneous, precise measurement of CO, CO2, CH4 , and H2O for lab, field or mobile applications.
- Parts-per-billion sensitivity, precision and accuracy with exceptionally low drift
- Rugged and insensitive to changes in ambient temperature
- Compliant with international ambient atmospheric monitoring networks, including the World Meteorological Organization (WMO) and the Integrated Carbon Observation System (ICOS)
The Picarro CO Monitor uses Cavity Ring-Down Spectroscopy.
Nearly every small gas-phase molecule (e.g., CO2, H2O, H2S, NH3) has a unique near-infrared absorption spectrum. At sub-atmospheric pressure, this consists of a series of narrow, well-resolved, sharp lines, each at a characteristic wavelength. Because these lines are well-spaced and their wavelength is well-known, the concentration of any species can be determined by measuring the strength of this absorption, i.e. the height of a specific absorption peak. But, in conventional infrared spectrometers, trace gases provide far too little absorption to measure, typically limiting sensitivity to the parts per million at best. CRDS – Cavity Ring-Down Spectroscopy – avoids this sensitivity limitation by using an effective pathlength of many kilometers. It enables gases to be monitored in seconds or less at the parts per billion level, and some gases at the parts per trillion level.
In CRDS, the beam from a single-frequency laser diode enters a cavity defined by two or more high reflectivity mirrors. Picarro analyzers use a three-mirror cavity, as in the figure below, to support a continuous traveling light wave. This provides superior signal to noise compared to a two-mirror cavity that supports a standing wave. When the laser is on, the cavity quickly fills with circulating laser light. A fast photodetector senses the small amount of light leaking through one of the mirrors to produce a signal that is directly proportional to the intensity in the cavity.
When the photodetector signal reaches a threshold level (in a few tens of microseconds), the continuous wave (CW) laser is abruptly turned off. The light already within the cavity continues to bounce between the mirrors (about 100,000 times), but because the mirrors have slightly less than 100% reflectivity (99.999%), the light intensity inside the cavity steadily leaks out and decays to zero in an exponential fashion. This decay, or “ring down”, is measured in real-time by the photodetector, and the amount of time it takes for the ring down to happen is determined solely by the reflectivity of the mirrors (for an empty cavity). Consider that for a Picarro cavity of only 25 cm in length, the effective pathlength within the cavity can be over 20 kilometers.
Now, if a gas species that absorbs the laser light is introduced into the cavity, a second loss mechanism within the cavity (absorption) is now introduced. This accelerates the ring down time compared to a cavity without any additional absorption due to a targeted gas species. Picarro instruments automatically and continuously calculate and compare the ring down time of the cavity with and without absorption due to the target gas species. This produces precise, quantitative measurements that account for any intra-cavity loss that may be changing over time, and it allows the discrimination of loss due to absorption from losses due to the cavity mirrors. Furthermore, the final concentration data is particularly robust because it is derived from the difference between these ring down times and is therefore independent of laser intensity fluctuations or absolute laser power.
This scheme of comparing the ring down time of the cavity without any absorbing gas, with the ring down time when a target gas is absorbing light is accomplished not by removing the gas from the cavity, but rather by using a laser whose wavelength can be tuned. By tuning the laser to different wavelengths where the gas absorbs light, and then to wavelengths where the gas does not absorb light, the “cavity only” ring down time can be compared to the ring down time when a target gas is contributing to the optical loss within the cavity. In fact, the laser is tuned to several locations across the target gas’s spectral absorption line (and ring down measurements are conducted at all these points) and a mathematical fit to the shape of that absorption line is what is actually used to calculate the gas concentration.
Visit the CRDS technical description for the calculations used by the instrument to convert raw signals into concentration data.
Light intensity as a function of time in a CRDS system with and without a sample having resonant absorbance. This demonstrates how optical loss (or absorption by the gas) is rendered into a time measurement.
As and when needed
Field Data
- The instrument produces a range of out files and all are text format.
- The user can download (but not delete) this data from the instrument but it should be noted that this data will not have been quality controlled.
Archive Data
- Data is provided in NetCDF files following the AMOF data standard
- Files contain no more than 24hr of data.
- Instrument name is
- ncas-co-piccaro-1
- The data product(s) associated with this instrument:
- Example data file

